
Introduction
One of the greatest pleasures of my job is meeting many early stage entrepreneurs every week. I estimate that about 70% of the companies I meet have SaaS or subscription-based revenue models. Because of this, and because a core area of our investment mandate is to invest in enterprise SaaS businesses, I wrote this piece, which was initially an internal guide to explain how to systematically analyze a company’s SaaS metrics.
What follows is a set of analytical methods that a VC may use during diligence or the general decision-making process.
This piece is intended for SaaS entrepreneurs raising a financing round. Understand how investors use SaaS metrics and how best to present them and you will increase the likelihood of getting venture funded.
Growth Characteristics
SaaS companies have many characteristics driving their valuation, but the factor most correlated to valuation multiples of public SaaS companies is growth. Growth – in revenue or gross margin dollars – is the single most significant factor differentiating a best-in-class SaaS company from its peers.
MRR and Customer Count Growth
To properly evaluate the quality of growth, we usually create the following spreadsheet showing data on a monthly basis:

Comments:
- Net new MRR should ideally increase each month or at a minimum each quarter.
- For an enterprise SaaS business, we generally look for revenue to go from zero to $1 million of ARR (annualized recurring revenue) or ~$85,000 MRR (monthly recurring revenue) within 12 months (or less) of product launch.
- At $1 million ARR, best-in-class ARR growth is generally 200-300% per year. At $10 million of ARR, best-in-class is generally in the 150 – 200% range (1).
- For post Series A growth rates, there is a good rule of thumb (2) which says that several successful SaaS companies grow at a rate to triple, triple, double, double, and double ARR – after reaching the $2 million ARR level.
By the way, when examining current run-rate revenue, some investors advocate the use of a term called CMRR (committed monthly recurring revenue) rather than MRR. CMRR adjusts MRR to subtract out known or expected churn and adds in-production, contracted MRR. As a static point in time number, CMRR is certainly superior to MRR. It is basically a forward-looking version of MRR. Whenever I refer to MRR you could replace it with CMRR.
Quick Ratio (3)

Comments:
- The SaaS quick ratio is relevant for companies in year two of revenue and beyond. In the first year of revenue, companies generally don’t see significant churn (see below).
- A ratio above 4x is good. A ratio of 2x or below means that sales are too low or churn is too high. It is a high bar but we regularly use it to evaluate companies.
Churn and Renewal
Churn is important for SaaS businesses because even if a company is currently growing at an encouraging rate, high churn will limit the growth of the company at scale and also limit the total revenue potential of the business.
We examine churn by understanding the data in the following exhibit:

It is instructive to look at both dollar churn and customer count churn. Typically, churn by customer count is higher than dollar amount (the logic being that smaller customers usually churn off faster). The reason it is important to look at both metrics is because it is possible to do well on one but still have churn issues. For example, if a company lost its biggest customer, the customer count churn would look fine but the revenue churn may be problematic. Conversely, if many smaller customers churn off, that may signal difficultly upselling or issues with the entry-level product.
It is also useful to look at churn in a segmented fashion, by customer category and vintage (more on that in the cohort analysis section).
There are two types of churn: gross churn and net churn.
Gross Churn (%)

Comments:
- Churn is most useful to look at in year two and beyond. I often hear companies within their first year of sales saying they have zero churn. This is not unusual since a customer is unlikely to churn off when they are still under contract and have already paid for the service (assuming annual contract terms).
- Similarly, I have heard companies talk about exhibiting zero churn in a product that is currently in a freemium phase. For obvious reasons this would also not be surprising.
- I find the easiest way to think about churn benchmarks is to first look at it on an annual basis and then back into what this implies on a monthly basis.
- On an annualized basis, best-in-class companies in this metric typically have gross MRR churn below 5% (this is excellent) and logo churn of 7% or below. We generally look for gross MRR churn in the 5-10% range or below. I would also note that in most cases, churn at these companies is not usually due to competitive loss.
- A best-in-class gross annual MRR churn of 5% would imply gross monthly MRR churn of about 0.5%. In general, for an enterprise SaaS business, gross monthly MRR churn above 2% is cause for concern and gross monthly MRR churn in the 3%+ range is high.
- Note that there are churn differences between small versus medium/large sized enterprise sales. Churn among small customers will be higher because smaller companies go out of business at a higher rate and smaller sales are less entrenched than larger sales. While churn will be higher, small customer acquisition costs are usually lower (discussed below) so the overall economic attractiveness of this category can still be compelling.
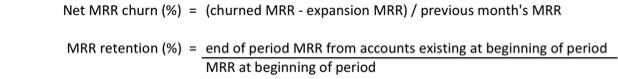
Net MRR Churn (%) and Dollar Retention
The difference between gross and net churn is that net churn adds the impact of customer expansion. MRR retention also includes the impact of both gross churn and upsells.
Comments:
- Best-in-class mid market and enterprise companies are able to grow their revenue per retained account by 3% or even 4% per month.
- We typically look for net churn to be negative. Many good SaaS companies have achieved this in year two and beyond.
- Achieving MRR retention in excess of 100% is equivalent to achieving negative net churn. MRR retention of 110% on an annual basis is good and 125% or higher is excellent.
- Many companies we meet add negative churn to their forward revenue projections. Unless this is already exhibited in an existing customer base with some scale, most VCs will usually haircut this.
Understanding How License Revenue Scales
To ascertain the likelihood of achieving meaningful negative net churn, it is necessary to understand the software license price points and how the license revenue scales (from upselling and cross selling). Below are the factors along which license revenue typically scales:
- Number of users / seats.
- Features, i.e. basic, pro, or enterprise editions, for example. Higher price points may offer advanced features including:
- Access across devices, automatic syncing, search functionality
- Greater number of integrations offered
- Customization including the ability to use your domain name or customized dashboards
- Other enterprise grade features including security, control, certifications
- Depth of usage: amount of storage used, database size, number of markets covered, number of profiles, etc.
- Sale of additional modules.
Renewal Rates
Customer and dollar renewal rates are very important metrics to analyze. In many ways renewal rates are more telling metrics than churn because when you include all customers in the denominator you can underestimate the true churn rate. This is especially true in the early days when the company is growing and many customers may be locked into the contracted term. The real test of product value is what portion of customers – of those up for renewal – actually decide to renew.

Comments:
- As with churn, it is instructive to look at renewal rates on both a dollar and customer basis.
- It is useful to track customer and dollar renewal rates by cohorts over time (see below) to see how the trends are progressing over time.
Unit Economics
Unit economics examines the gross margin on customer revenue and compares it to the costs to acquire that revenue. This analysis is conceptually sound and important to perform, especially for SaaS companies in year two of revenue and beyond, where there is enough data to properly do the analysis. For earlier stage SaaS companies, it can also be useful to go through this exercise to make sure that the price point of your product can profitably support scaling your sales channels. To this point, for a business whose product is sold via an enterprise sale, it would be important to confirm that the product’s achievable price points are high enough to support an enterprise sales force. I learned this lesson the hard way early in my VC career.
It is interesting to note that the majority of all the SaaS companies we meet present strong LTV/CAC metrics. The reason is that, especially for early stage companies, it is often difficult to accurately measure lifetime value (and therefore overestimate it), and, whether intentional or not, it is easy to exclude certain legitimate cost components of customer acquisition. Therefore, while we always perform this analysis, we don’t put too much weight on it if the MRR growth characteristics described in the earlier sections are not up to snuff.
Two quick points on methodology. First, it is often instructive to examine these metrics in a segmented fashion, i.e. by product, channel, customer segment, or pricing scheme, in addition to doing the analysis on an aggregated basis. Second, many companies mistakenly show the analyses below using revenue rather than using gross margins.
The primary unit economics calculations to keep in mind are explained in the remainder of this section.
LTV / CAC Ratio (4)

Comments:
- ARR can be used in the numerator (instead of MRR), in which case the denominator will also need to use annual numbers.
- In the numerator, the lifetime length is the inverse of the churn rate and will be in the same units, so if you use monthly churn you will get lifetime in months.
- At the seed stage, it is difficult to accurately know what CAC will be. It is important to find out what acquisition costs are by channel as soon as possible. Additionally, it is hard for startups to predict retention, but for modeling purposes an entrepreneur can conservatively use 3-4 years for SMB and 5-7 for enterprise customers (1).
- Some analysts discount the future value of gross margin dollars over the lifetime value (using a 15% discount rate for example).
- There is also a formula that can be used if MRR per account is growing. This is more applicable to more mature companies. Unless there is a demonstrated track record of MRR growth per account, we usually won’t use this.
- We would generally look for a LTV > 3x CAC. Best-in-class companies can have ratios as high as 7x or 8x.
Sales and Marketing Efficiency
There are several metrics that can be used to evaluate the revenue generated from sales and marketing investment. The metrics below are slightly different but they all illustrate the same concept.

Comments:
- Note that these metrics do not factor in the contract duration, upsells, or churn (and therefore should not be used in isolation).
- Months to recover CAC and CAC payback period should be less than 12 months; can be as low as 5-7 months, which is very good. More than 36 months is not good.
- The payback periods in the SMB segment (typically 6-18 months) needs to be shorter than the enterprise segment (which can be as high as 24-36 months) due to higher churn.
Magic Number (5)
- The magic number is essentially the inverse of the first two metrics (although it does not take marginal profitability into account).
- Benchmarks are:
- Above 0.75: step on gas
- Below 0.75: evaluate business
- Below 0.5: not ready to expand
Cohort Analysis
Cohort analysis examines how the characteristics of a group of customers that joined in a particular month changes over time. This analysis is useful because it allows us to see whether company performance is improving over time.
We use the exhibit below to understand whether customer and MRR churn are improving with more recent cohorts. Within a data table, looking from left to right within the same color shading will ideally show improving metrics.

Cohort analysis can be used to track a number of other features including:
- Average revenue per account
- Price per seat
- LTV
- Conversion to paid rate
- Average contract length
- Months paid upfront
- Engagement metrics
- Customer conversion
- Sales cycle time
Important Operating Metrics
Months Upfront. This is the average months of payment received upfront for new bookings. All else equal, it is good to have a higher number because it is a source of working capital funding.
Often, it can be a good idea to incentivize salespeople in part on this metric. It is a fine balance though because being too aggressive here may depress sales. If you have to decide between higher months upfront or higher MRR, MRR is the more important metric to maximize.
Funnel Metrics Tracking. It is important to track qualified leads (as best defined by your sales or marketing team) over time. This should be increasing over time. Flat or decreasing leads could foretell future MRR growth issues.
Customer Engagement Metrics. Engagement metrics differ by business but VCs will usually ask you to provide the engagement metrics you believe to be most important. These could be number of active users, visit frequency, activity time, any of a number of core user actions, or other metrics that indicate business value to the user. It is useful to track these metrics using cohort analysis as well.
Ultimately, when there is enough data, you can run correlation analysis along these factors on the customers that were lost and those that were retained over time. This analysis can be used to identify which customers represent a churn risk so action can be taken to retain them.
Customer ROI. A key question to think about deeply is how a customer measures the ROI of buying the product. Sometimes this is hard to conceptualize but the best companies have thought about how to quantify business value.
Customer Concentration. Generally for a Series A investment, we will look for companies with 10 or more customers (on the enterprise side). There is no hard and fast rule here but generally, it is better if no customer comprises more than 15% of revenue – and the more fragmented the revenue, the better.
Revenue per Employee. $200,000 ARR per employee or above is a good benchmark for mature SaaS companies. Additionally, as employees are hired over time, revenue per employee at best-in-class SaaS companies generally grows (6).
Professional Services Revenue. We generally don’t like businesses with significant professional services revenue. If there is services revenue, it should be a relatively low portion of total revenue (10-15% or less). Additionally, the gross margin on that revenue should be in the 20% range.
Important Financial Metrics
Burn Rate and Cash-Out Date. Know the gross and net burn number on a monthly basis. Gross burn rate is all the cash out the door including finance charges. Net burn is the cash inflow minus the gross burn, which will be equal to the amount by which your cash balance is reducing each month.
It is also worthwhile to have the cash-out date top of mind. Cash-out date is cash balance divided by the net burn rate. This tells you how much runway you have ahead before running out of cash.
Capital Efficiency. In enterprise SaaS, capital inefficiency often manifests itself in the form of companies trying to raise a round prematurely, i.e. before they have hit their stage milestones. For example, we often see companies trying to raise an A round when they are at the seed stage or raise a B round when their metrics are really at the A stage.
When looking at an enterprise SaaS business, we will generally look at the ratio of capital that was spent to date to get to the current ARR level. While there is quite a range here, we have seen several SaaS companies reach the $1-2mm ARR mark with capital spent equal to 1.0 – 1.5x ARR.
Gross Margins Analysis. Growth in gross margin dollar volume and gross margin percentage are important metrics to track when evaluating a SaaS business.
Cost of goods sold (COGS) for SaaS businesses include the expenses directly related to producing the software that is sold, including: hosting fees, data license fees embedded in the product, professional services and training personnel costs, support personnel costs, and customer onboarding/implementation headcount costs. In general, hosting costs and customer success costs constitute the majority of SaaS COGS.
The median gross margin on subscription revenue (excluding services or perpetual license) for private SaaS companies is approximately 80% (7).
Closing Thoughts
A company that achieves excellence across all of the metrics discussed above is unusual and truly distinguished. While these metrics are very important, it is certainly not necessary to excel as best-in-class across all of these metrics to get funded and ultimately be a successful company.
As this piece shows, the analytics of SaaS companies can be complex, even for companies that are relatively small and early stage. I hope this guide is useful to you as you think about your SaaS metrics and that it helps you best position your business for a successful funding round.
Acknowledgments
David Skok of Matrix, Mamoon Hamid of Social+Capital, Tom Tunguz of Redpoint, Bessemer, and Pacific Crest have in particular provided excellent content and benchmarking on this topic. I have learned much from their valuable insights.
Thank you also to the team at Cue Ball team for their valuable insights and editing.
Footnotes
(1) Benchmarks from Bessemer VP. (2) From Neeraj Agrawal of Battery Ventures. (3) Formula and benchmarks Mamoon Hamid of Social+Capital. (4) Formula and benchmarks from David Skok of Matrix. (5) Formula and benchmarks from Josh James, founder of Domo and Omniture. (6) From Tom Tunguz of Redpoint. (7) From the Pacific Crest 2014 SaaS Survey.
Copyright 2015 Ali Rahimtula. All rights reserved.

Wow, amazing post and resource for founders who need the detail behind the basic metrics we all use for tracking growth and performance. Thanks for your effort on this!
LikeLike
Ali,
Great article, it will be very helpful for forecasting revenue.
Thanks for sharing.
LikeLike
Great article. I’ve printed for my weekend read. I’ve started setting up a lot of these metrics and calculations but it really exposes the data you need to track and what systems (if any) are collecting the raw data.
LikeLike
Ali,
Again, thanks for the article. A few questions.
Regarding the SaaS quick ratio, do you usually measure this over a quarter?
For net MRR churn (churned MRR – expansion MRR), are you netting out downgrades in the expansion number?
Thanks,
Ben
LikeLike
Ben – great questions. #1: for quick ratio, I think best to examine this monthly if possible. #2: Yes, downgraded MRR should be included in the churned number.
LikeLike